Public Health & Housing Risk Mapping – NHS Frimley Collaboration
In partnership with NHS Frimley, I mapped and analysed the overlap between poor housing conditions and childhood asthma, uncovering strong spatial links with deprivation. The findings informed targeted health interventions and were published as a scientific case study.
Learn more
Electric Vehicle Charging Point (EVCP) Spatial Analysis and Optimization
Through spatial modelling and statistical optimisation, I identified the most efficient cover EV charging point locations across the borough. The analysis achieved 80% accessibility for households without outside parking while minimising new installations.
Learn more
Travel Time Impact Analysis – Children’s Centre Restructure
By integrating travel time analysis with usage data, I assessed the impacts of reducing children’s centres across the borough. The evidence influenced the final restructure, leading to the retention of an additional centre to safeguard community access.
Learn more
Public Transport Accessibility Level (PTAL) Refresh – Transport Access Modelling
Using advanced spatial modelling and SQL-based data architecture, I developed a locally accurate PTAL refresh for a local authority. The results provided a clear basis for monitoring public transport accessibility and guiding strategic decisions.
Learn more
Library Access Impact Assessment – Travel Time Analysis
By developing a composite index of travel times and demographics, I evaluated multiple scenarios for changes in library provision. The insights guided evidence-based decisions, leading to the preservation of libraries as vital community hubs.
Learn more
Loneliness Index Development – Public Health & Spatial Analysis
Using Census data and transport accessibility, I recreated a Loneliness Index to highlight areas vulnerable to social isolation. The project informed public health planning and upskilled the Council team in GIS and spatial analysis.
Learn more
Spatial Impact Assessment – Council Service Consolidation
By integrating travel time modelling with the Index of Multiple Deprivation, I assessed how reductions in public service buildings would affect community access. This equity-focused analysis provided vital evidence for socially responsible decisions.
Learn more
Master’s Thesis – Long-Term Analysis of Forest Fires in Portugal
For my master’s thesis, I analysed 40 years of forest fire data in Portugal, integrating environmental, land use, and population datasets to uncover factors influencing fire patterns and severity. The research highlighted how tree species composition and land management practices affect fire size, providing insights for more sustainable forestry.
Learn more
Personal GIS Project – Finding the Best Location to Buy a House
Using GIS, I created a custom model to map areas meeting key housing criteria, from affordability to transport access. The approach clarified my search and demonstrated how spatial analysis can support practical, data-driven decisions.
Learn more
Public Health & Housing Risk Mapping – NHS Frimley Collaboration
To respect confidentiality and data protection requirements, the following maps have been anonymised.
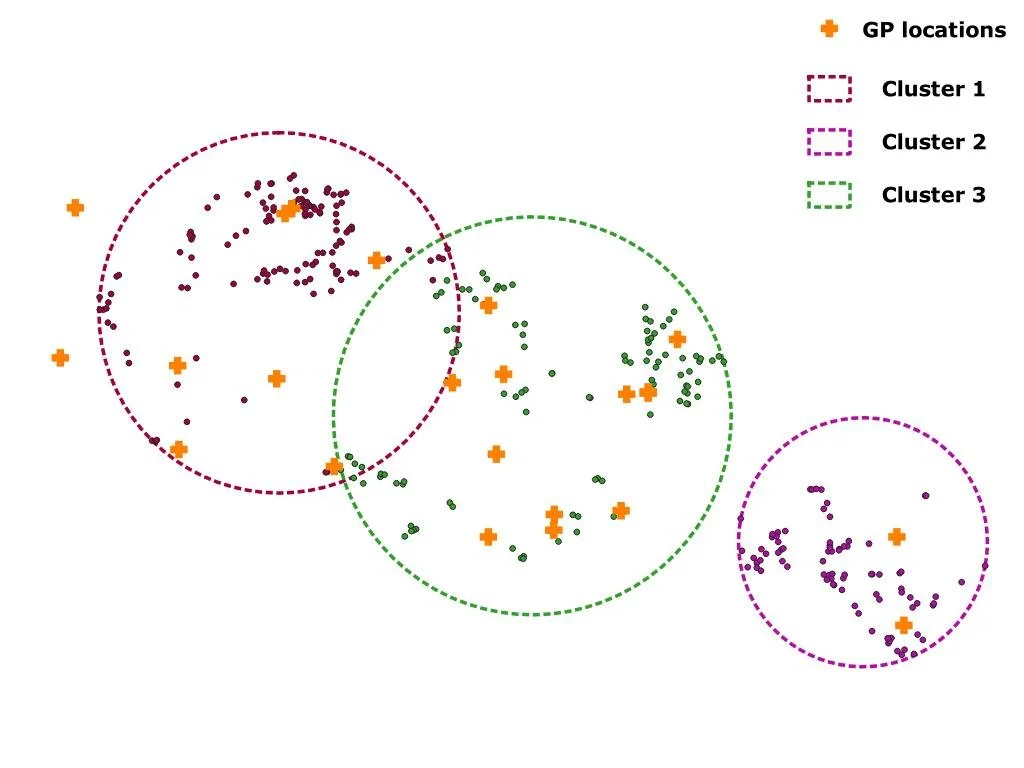
Cluster analysis of properties with mould housing children with asthma, and their proximity to the nearest GP.
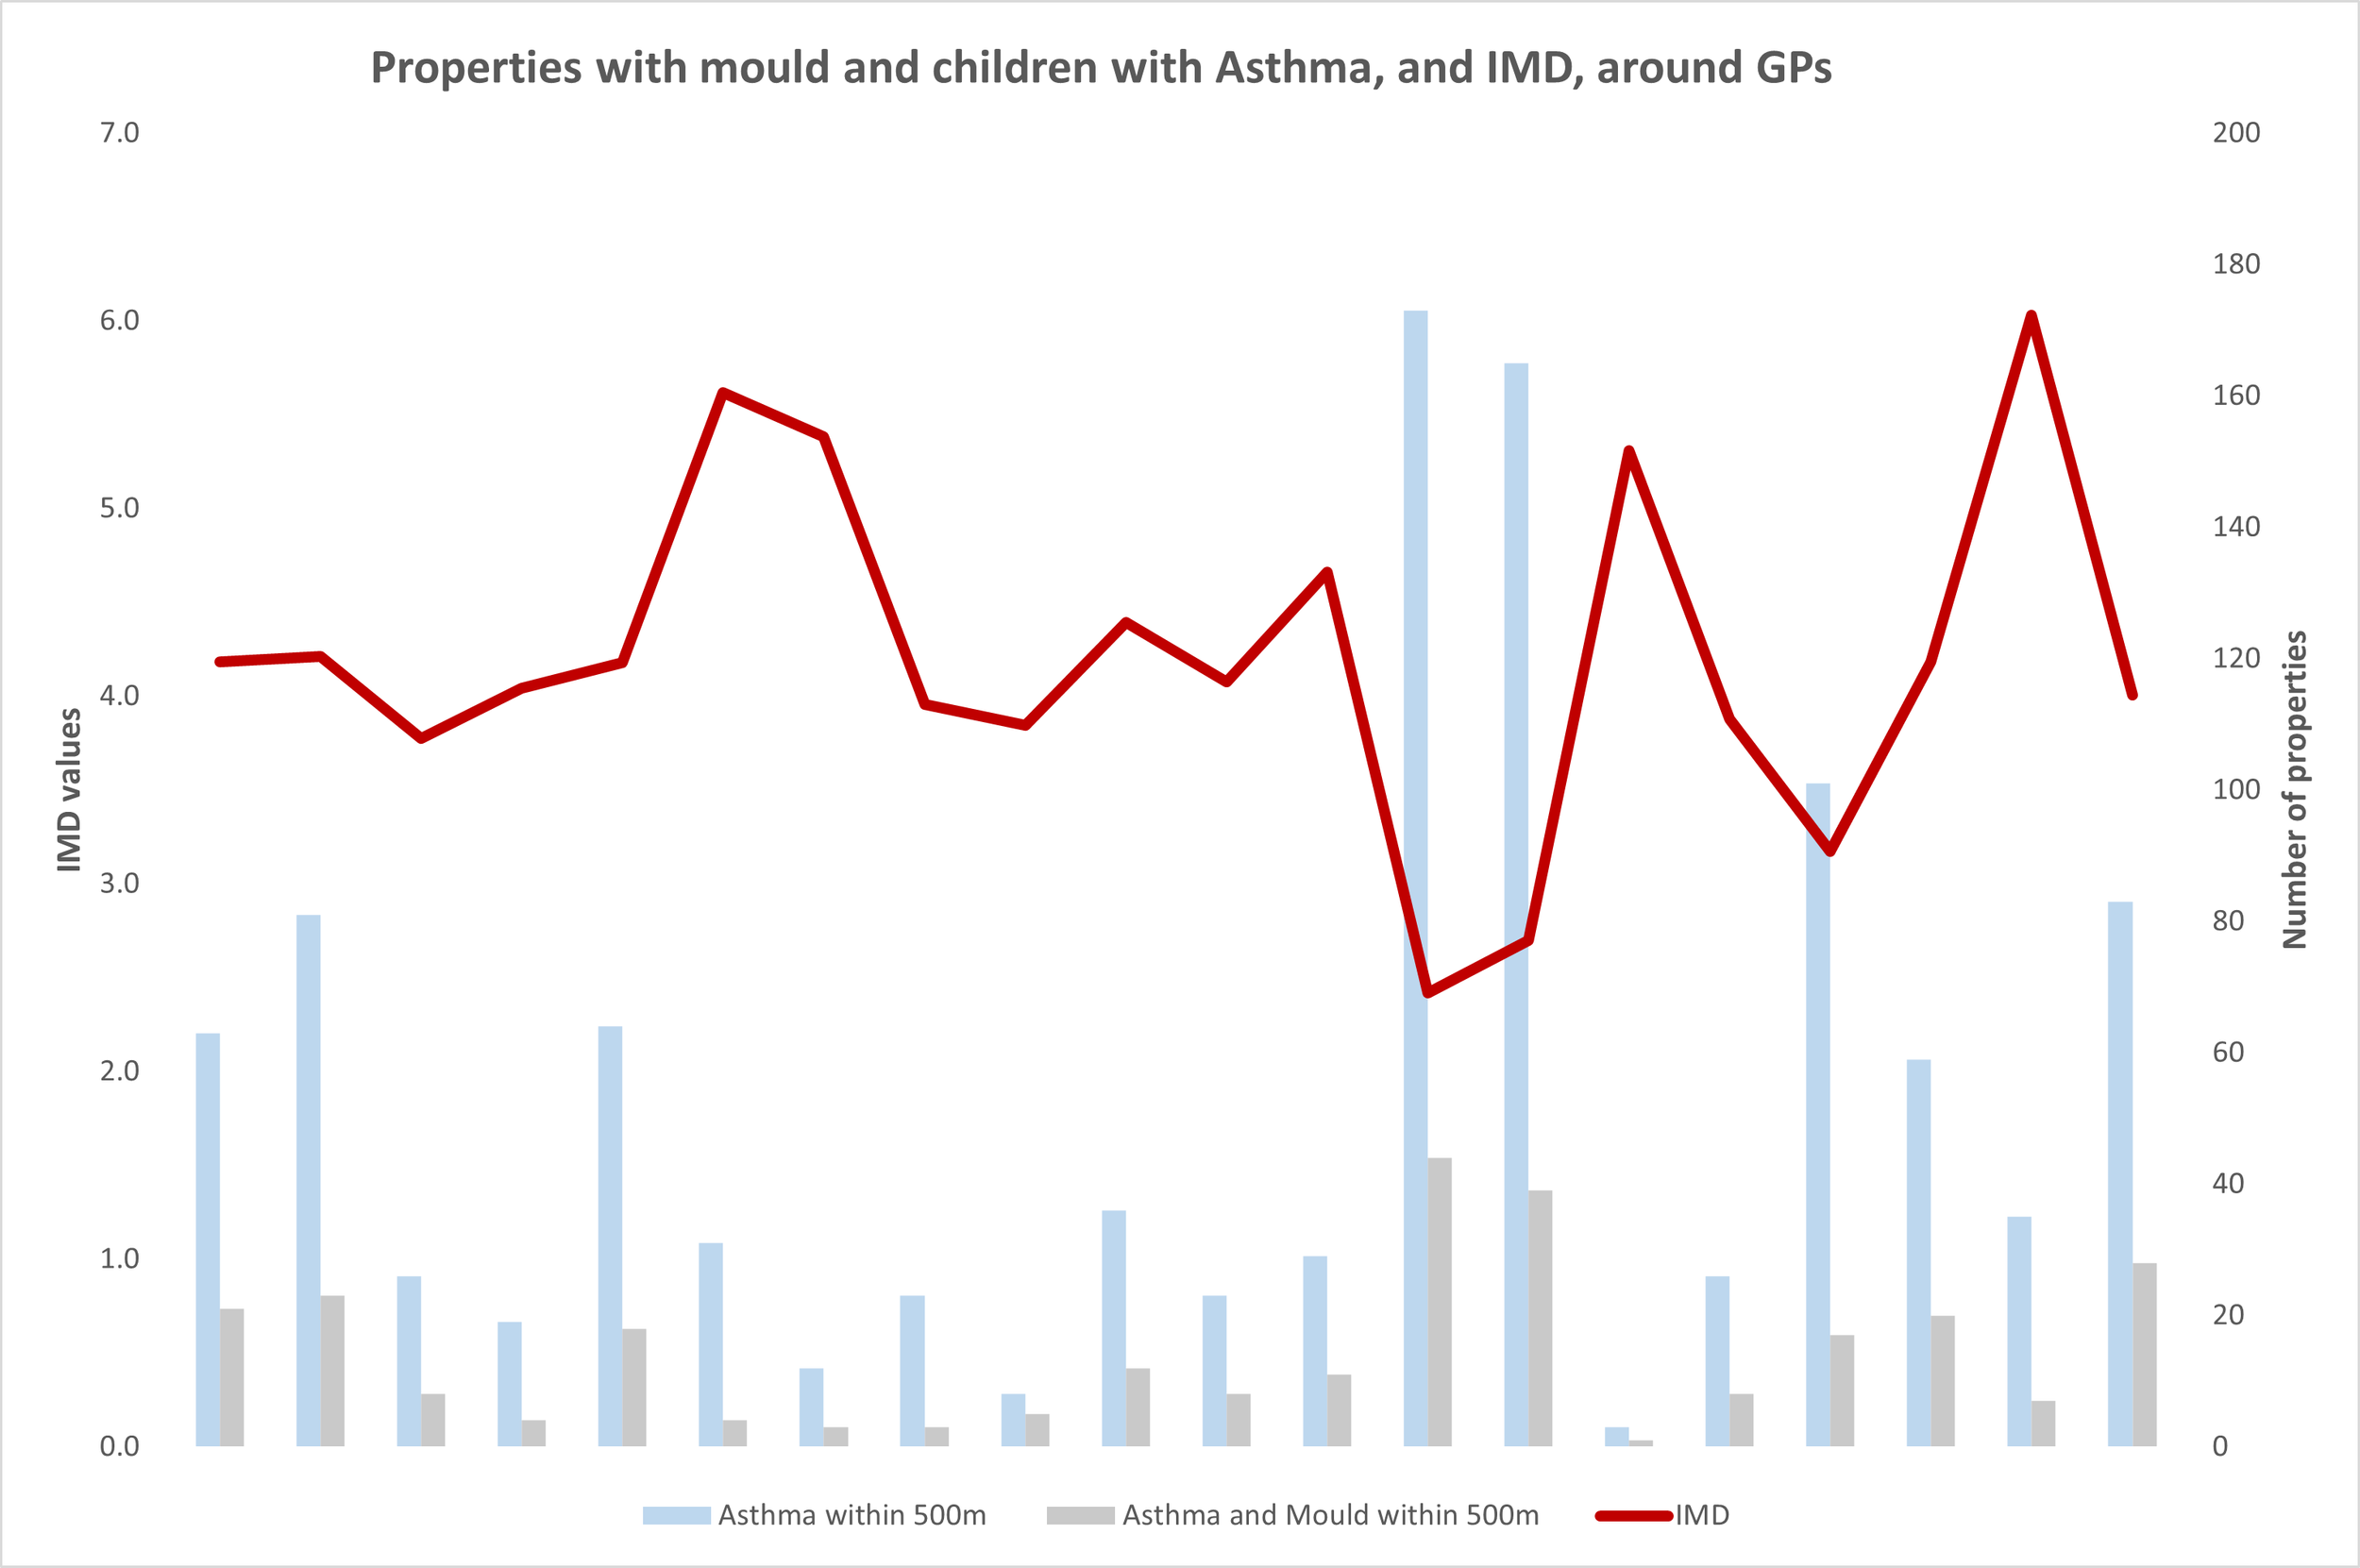
Geostatistical correlation between properties with mould housing children with asthma and the Index of Multiple Deprivation (IMD) values.
Tools used: QGIS, SQL scripting
One of the most impactful projects I’ve contributed to focused on public health, in partnership with NHS Frimley. The project aimed to identify properties where mould and damp had been reported and cross-reference them with residences of children diagnosed with asthma. The initial goal was to map both datasets and assess potential spatial correlations between poor housing conditions and respiratory health. The findings became the basis for a case study, which was later published as a scientific article.
Recognizing an opportunity to extend the value of the project, I took the initiative to standardize and integrate multiple datasets. This allowed for a more targeted analysis, identifying properties where both risk factors—mould/damp and children with asthma—coexisted.
Building on this, I carried out spatial analysis to identify the nearest GP practices to the high-risk clusters. This enabled the design of more effective communication strategies and localized health interventions.
To deepen the insight, I conducted a spatial correlation analysis between the Index of Multiple Deprivation (IMD) and the properties flagged in the earlier stages. The analysis revealed a strong relationship between housing conditions, asthma prevalence in children, and levels of deprivation. Over 300 properties with mould and housing children with asthma were identified, where 30 of these were identified within areas of very high deprivation, which directly informed follow-up actions and intervention strategies by the relevant authorities.
Article available on: Nursing Children and Young People. doi: 10.7748/ncyp.2025.e1552
Electric Vehicle Charging Point (EVCP) Spatial Analysis and Optimization
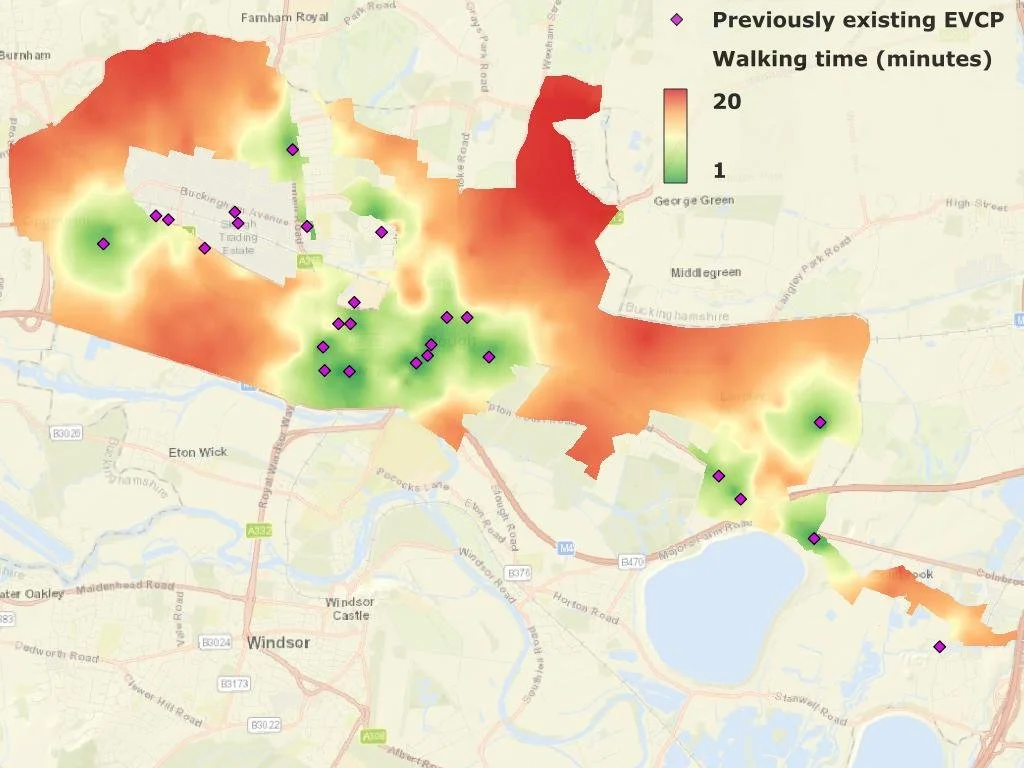
Baseline EV charging point coverage: low 5-minute walking access with existing charging points.
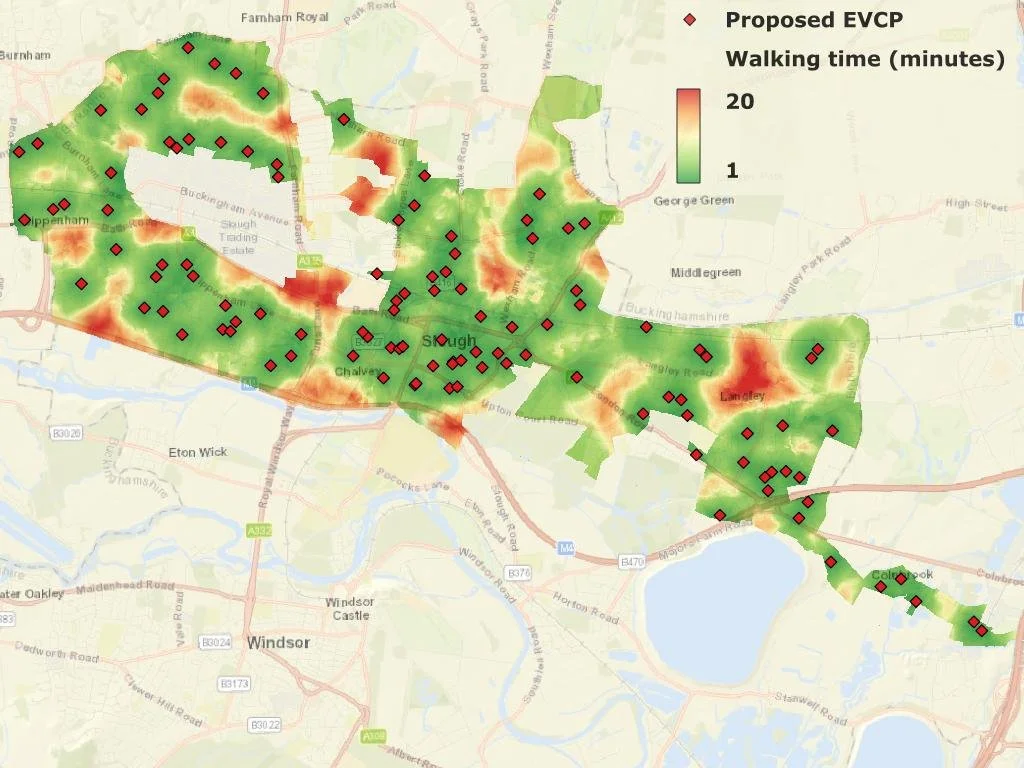
Baseline EV charging point coverage: high 5-minute walking access with proposed new charging points.
Tools used: QGIS, Python scripting, R scripting, Google API integration
As part of this project, I conducted spatial modelling and analysis to optimize the provision of electric vehicle charging points (EVCPs) across the Slough Borough Council. The objective was to ensure that at least 80% of properties without outside parking had access to a charging point within a five-minute walk—using the minimum number of installations necessary.
To achieve this, I developed a method to assess the existing EVCP coverage based on walking distances. Once the baseline coverage was established, I identified optimal locations that would serve the highest number of individual properties or clusters, such as apartment blocks, while maintaining the desired accessibility threshold.
In a later phase, I integrated existing urban infrastructure—such as lampposts and other suitable features—as potential EVCP locations. Additionally, I leveraged geographical boundaries to refine demand clustering and site selection, further improving the efficiency of the rollout strategy.
Following the spatial modelling, I applied statistical analysis to optimize coverage and ensure that each proposed EVCP location would serve a minimum number of properties without outside parking. This data-driven approach not only provided precise locations for utilizing existing urban features to achieve at least 80% coverage target. The final analysis empowered stakeholders with actionable insights for long-term, informed decision-making in EVCP infrastructure planning.
Travel Time Impact Analysis – Children’s Centre Restructure
To respect confidentiality and data protection requirements, the following maps have been anonymised.
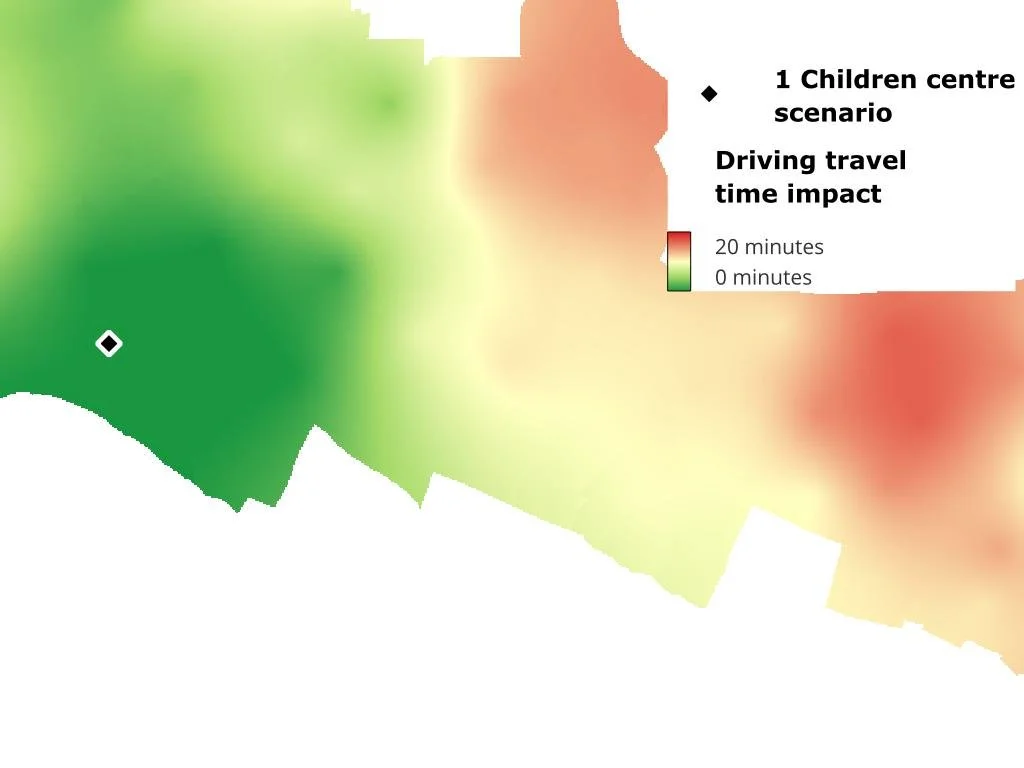
Driving travel time impact model for a hypothetical provision scenario.
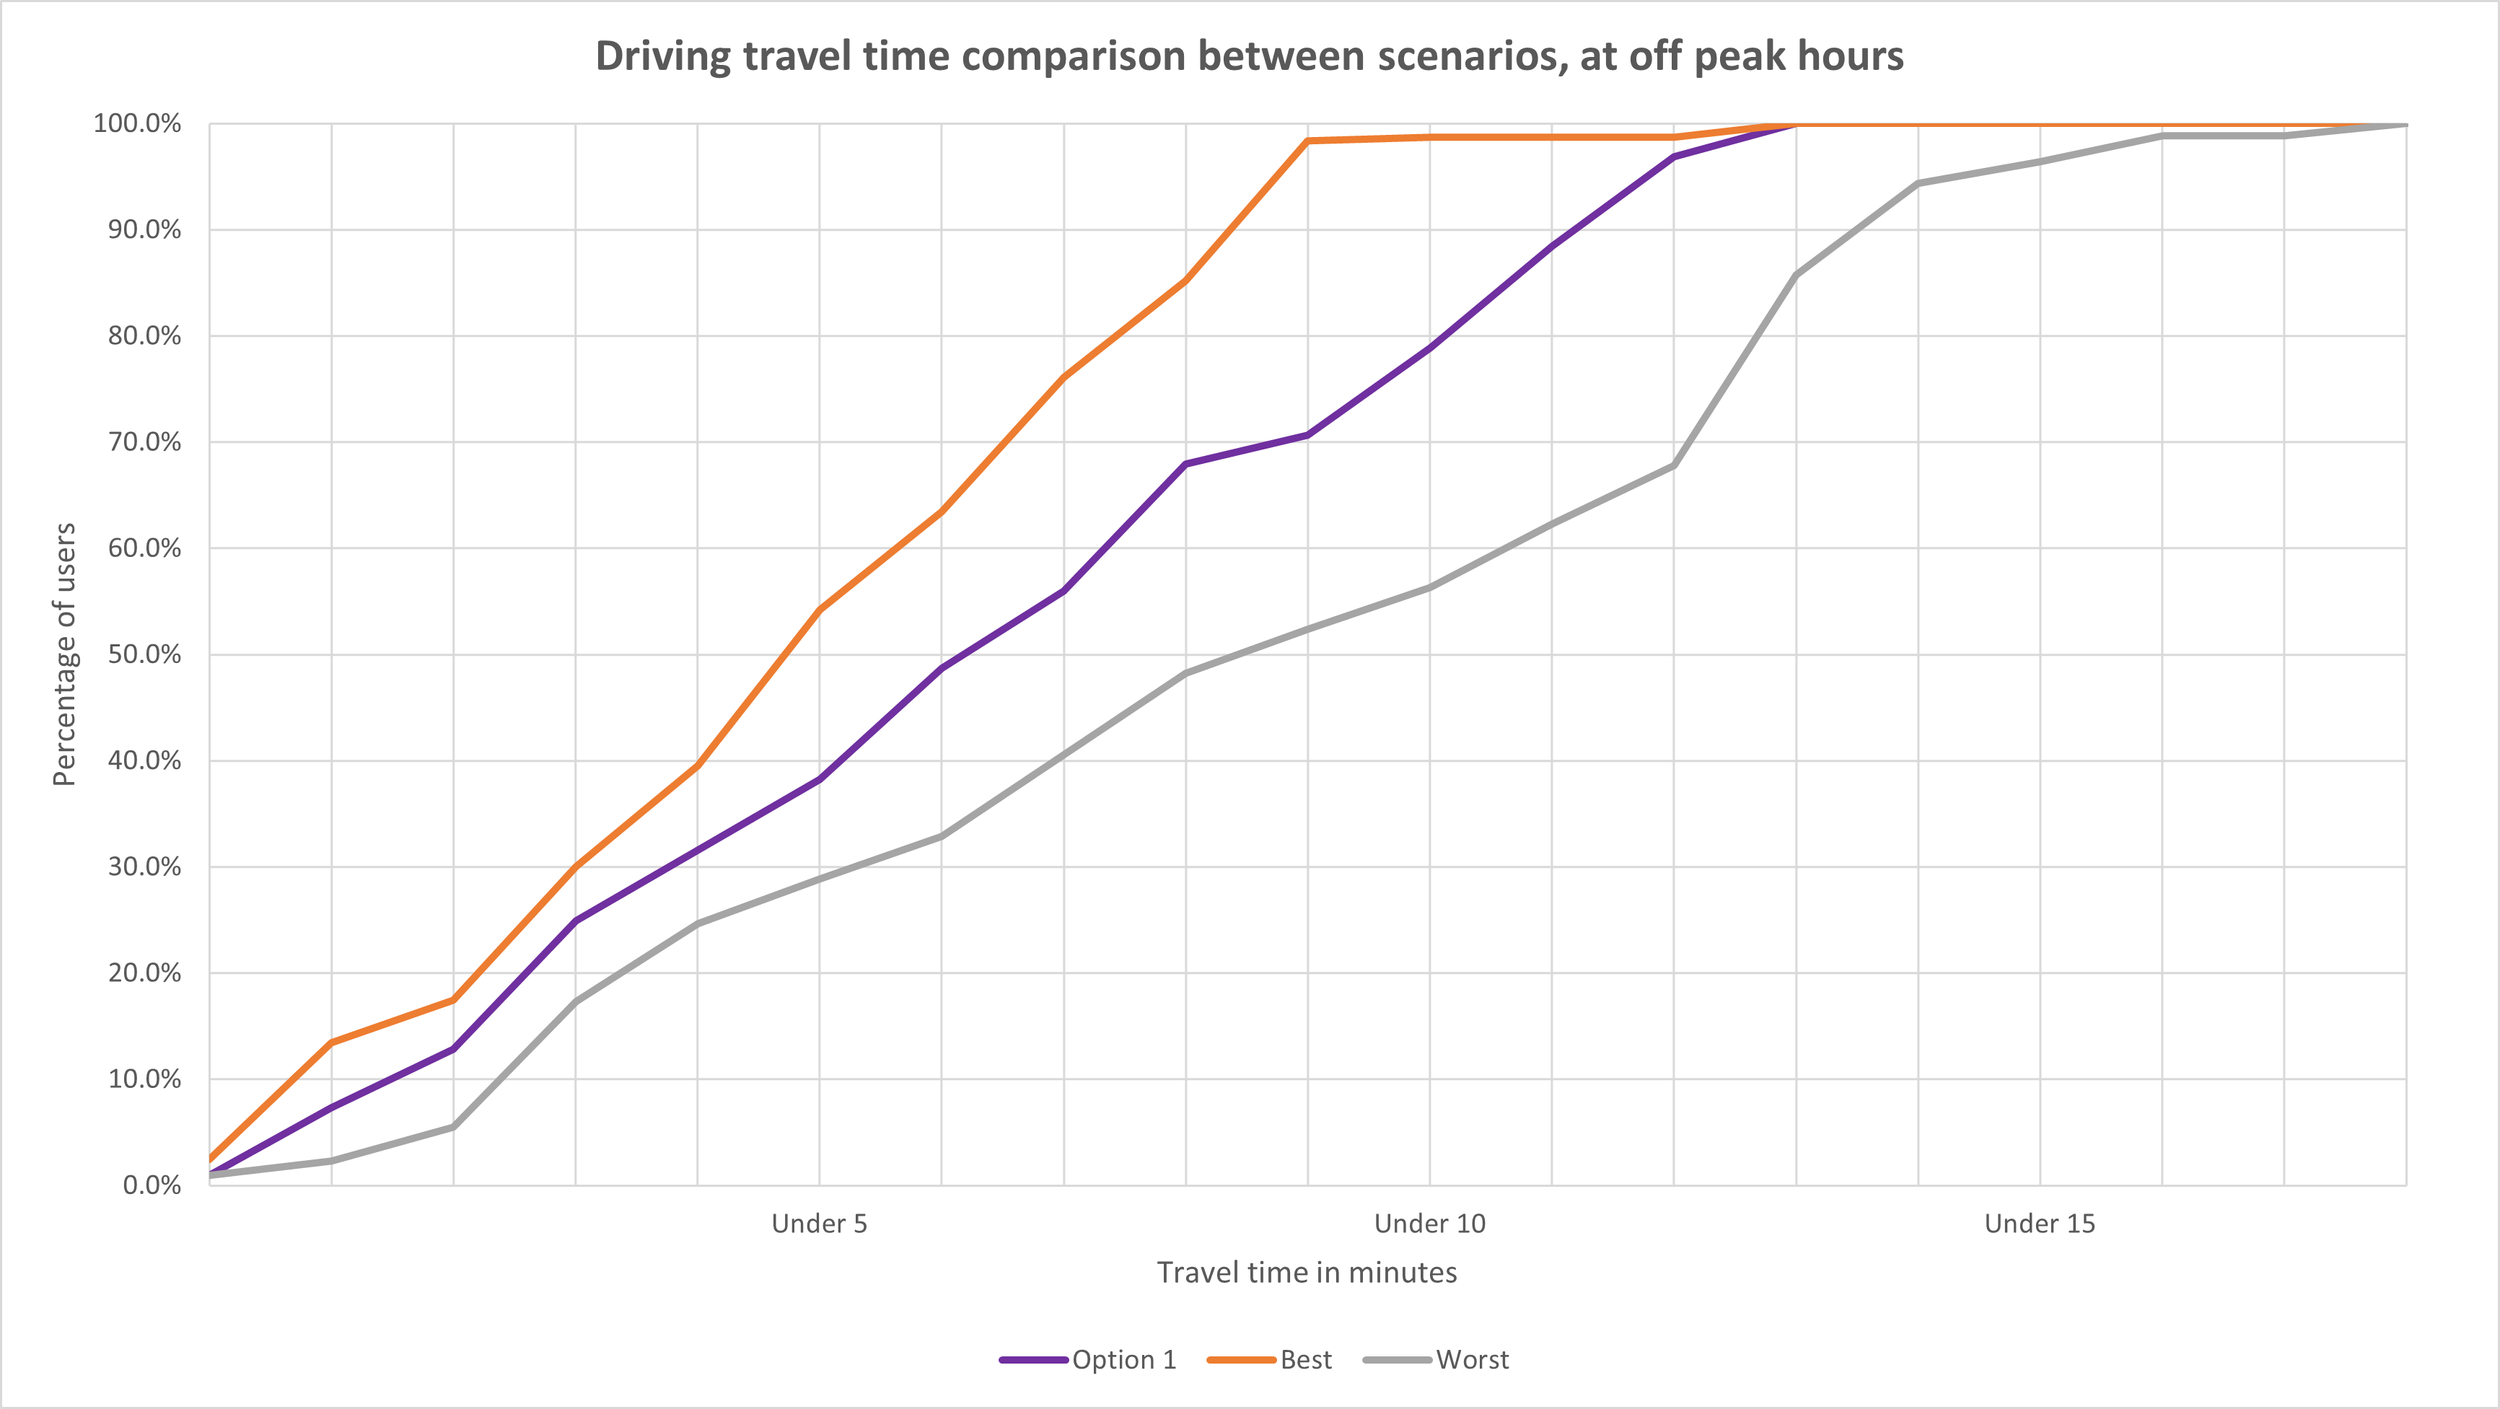
Comparison of driving travel times across proposed scenarios.
Tools used: QGIS, Google Distance Matrix API, Python scripting, R scripting
As part of a local authority children’s centre restructure, I was tasked with modelling the travel time impacts of reducing the number of centres across the borough. Given the sensitive, high-pressure nature of this project—with direct implications for families and communities—it was essential that the analysis be both highly accurate and delivered within a tight timeframe.
The modelling provided key evidence for decision-makers and directly influenced the final outcome. Based on the analysis, an additional centre was retained in the preferred option to mitigate potential negative impacts on accessibility. Despite the time-sensitive environment, the analysis delivered accurate, actionable insights and played a vital role in supporting a more informed and equitable decision-making process.
To achieve this, I integrated the Google Distance Matrix API to calculate travel times between each children’s centre and the geographic centroid of every Lower Super Output Area (LSOA) in the borough. This allowed for a robust spatial analysis, where the proposed preferred reconfiguration of children’s centres could be compared against all other possible combinations.
Each scenario was ranked based on overall travel time impacts, allowing us to identify options that minimized disruption. To add further depth and realism, I incorporated user-weighted modelling—ensuring that the number of families using each centre influenced the final ranking of options.
Public Transport Accessibility Level (PTAL) Refresh – Transport Access Modelling
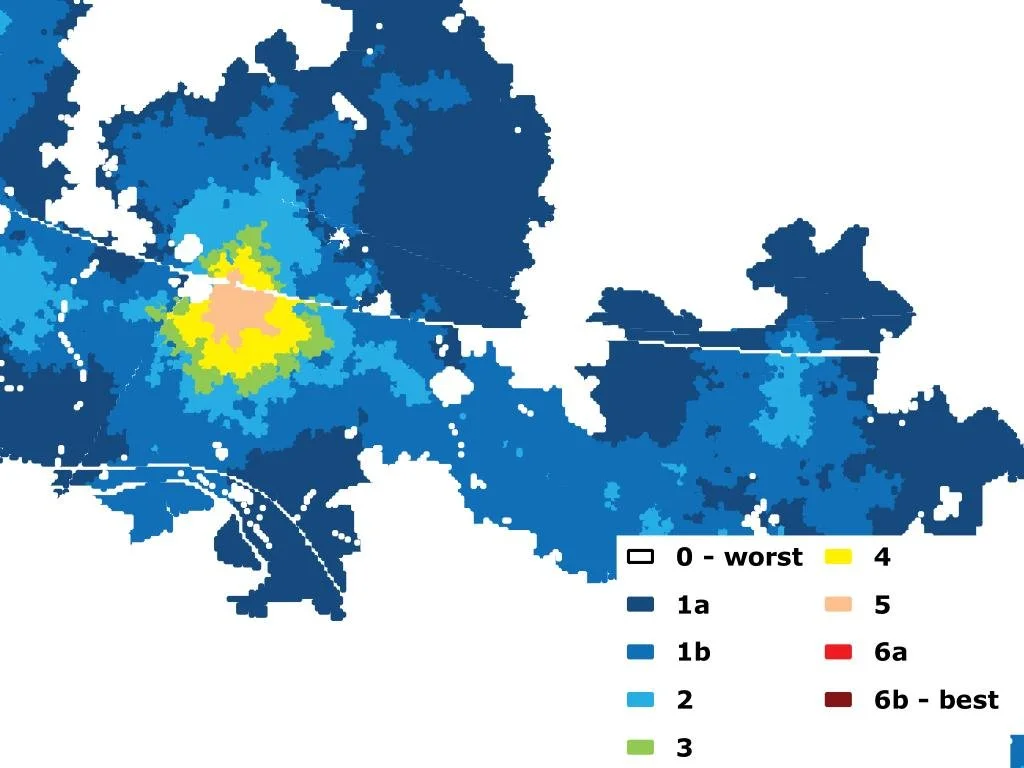
PTAL values across the study area
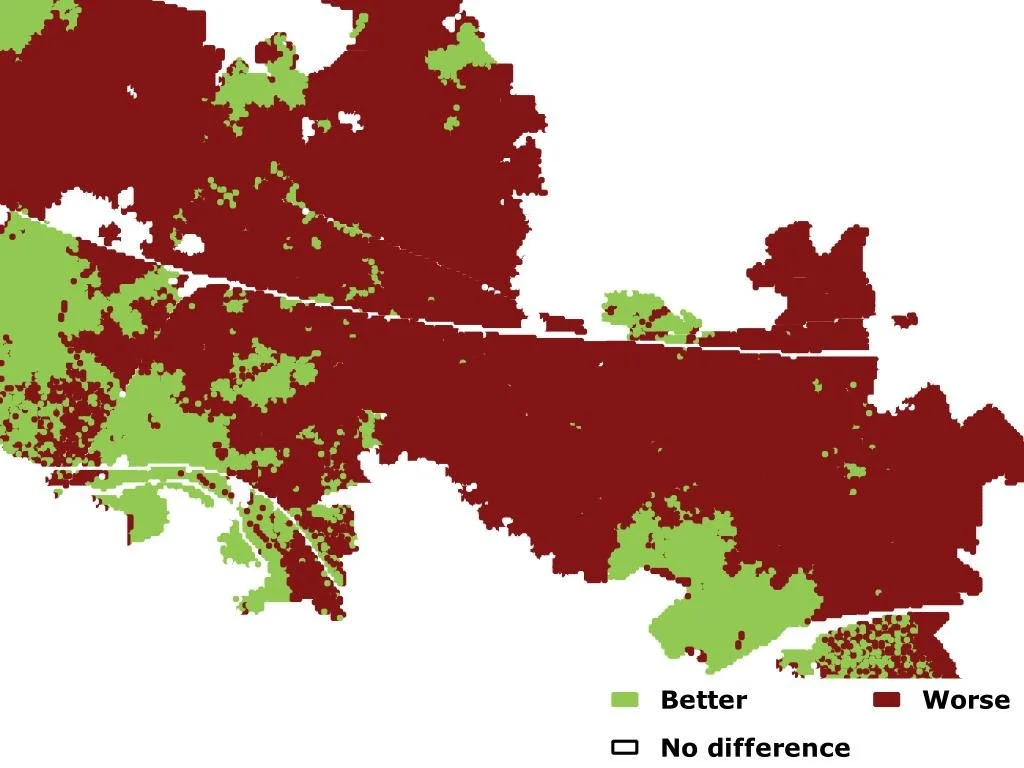
Differences between newly estimated and previous PTAL, highlighting a service provision difference between both years
Tools used: QGIS, PotsgreSQL/PostGIS scripting
One of the most complex and rewarding projects I’ve undertaken involved delivering a PTAL (Public Transport Accessibility Level) refresh for a local authority. Originally developed for London boroughs, the PTAL methodology requires strict adherence to specific criteria—measuring proximity to public transport nodes and the frequency of services at defined times of day.
To ensure the analysis was both accurate and robust, the model needed to evaluate accessibility at a highly granular level across the borough. This involved calculating shortest walking paths to transport nodes, factoring in service frequency, and accounting for physical restrictions such as barriers and non-accessible areas. Managing this complexity required a well-structured SQL-based spatial data architecture capable of handling high data volumes and the intensive processing demands of the analysis.
The final output delivered a fully updated and locally accurate PTAL model, directly comparable to previous versions. This allowed the authority to track changes in public transport accessibility over time, informing future planning and investment decisions.
Library Access Impact Assessment – Travel Time Analysis for Service Restructuring
To respect confidentiality and data protection requirements, the following maps have been anonymised.
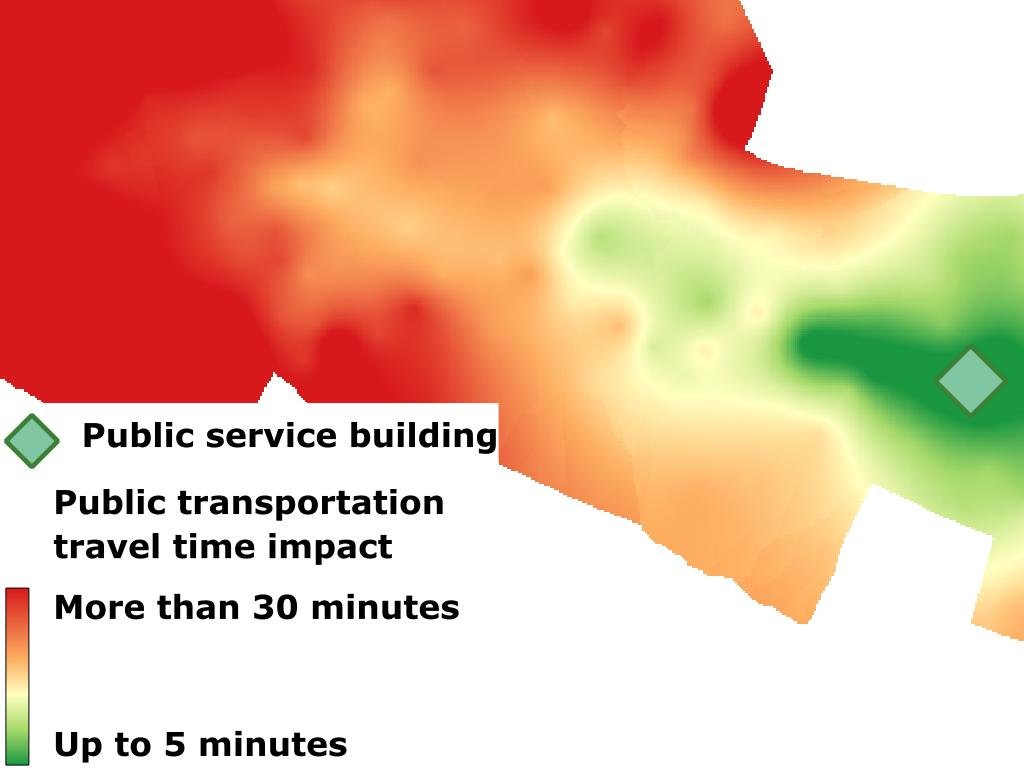
Travel time impact model for hypothetical library provision scenario (A)
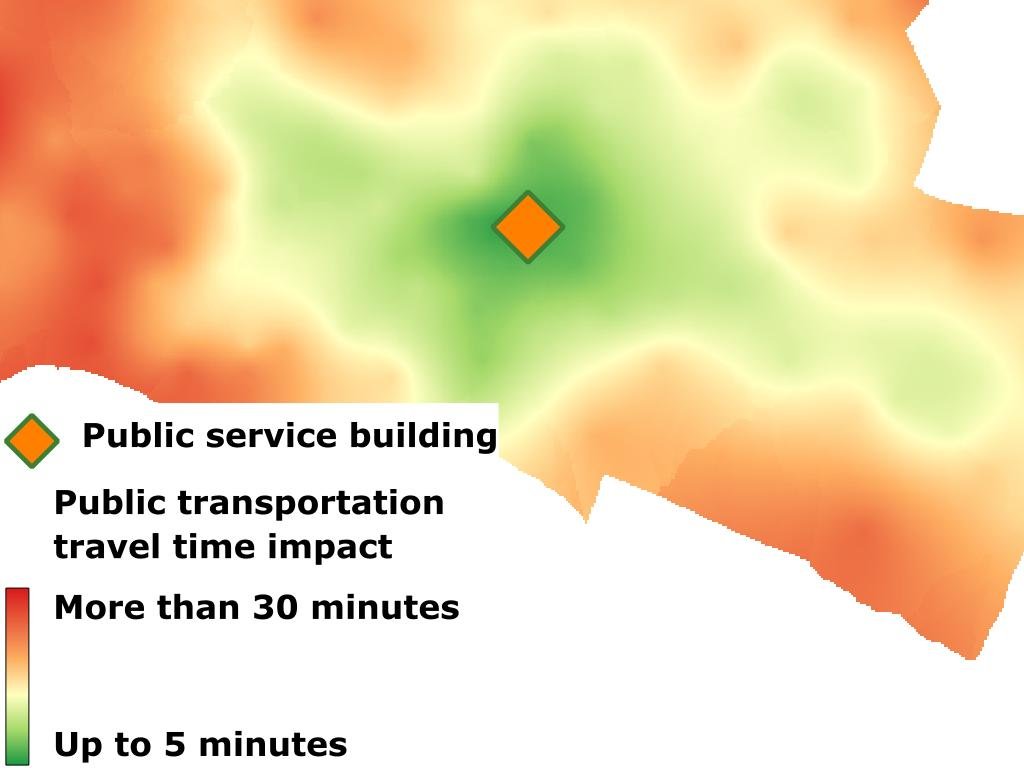
Travel time impact model for a hypothetical library provision scenario (B)
Tools used: QGIS, Google Distance Matrix API, SQL scripting
As part of a financial restructuring programme, I contributed to a decision-making insight taskforce tasked with assessing the travel time impacts of potential reductions in library provision across a local authority. Given that libraries often function as vital community hubs, it was crucial to evaluate all options with a strong evidence base and sensitivity to community needs.
This analysis proved to be a key insight in the overall decision-making process. Informed by this work and other supporting evidence, the authority ultimately chose to maintain the existing library provision, prioritising accessibility and community wellbeing.
To support this analysis, I developed a composite index combining data from the Google Distance Matrix API and Census demographics. This approach allowed us to classify areas of the borough based on how changes to library provision would impact accessibility.
Once data from all relevant sources was processed, I modelled multiple scenarios—testing every possible library configuration against the current provision. These scenarios helped identify the travel time implications for different communities, both visually and statistically, enabling decision-makers to compare options in a meaningful, evidence-based way.
Loneliness Index Development – Public Health & Spatial Analysis
To respect confidentiality and data protection requirements, the following maps have been anonymised.

Loneliness Index by Super Output Area (LSOA)
My role involved adapting and replicating this analysis for a different local authority, ensuring methodological consistency while tailoring it to the specific context of the new area.
Given that this geospatial-statistical approach was new to the Council, the project also served as an excellent opportunity to build internal capability. I provided guidance on both the spatial workflows and statistical methods, helping introduce team members to Geographic Information Systems (GIS) and spatial analysis practices.
Tools used: QGIS
As part of a public health initiative, I was tasked with coordinating the development of a Loneliness Index for a local authority, using the methodology outlined by Lucy and Burns (2017). Originally applied in the London Borough of Southwark, this approach combines Census data with Public Transport Accessibility Levels (PTAL) to produce a spatial composite index highlighting areas at greater risk of social isolation.
As a result, not only was the index successfully recreated, but the process also contributed to upskilling the team—building confidence and competence in spatial analysis techniques that can be applied to future public health and planning projects.
Spatial Impact Assessment – Council Service Consolidation
To respect confidentiality and data protection requirements, the following maps have been anonymised.
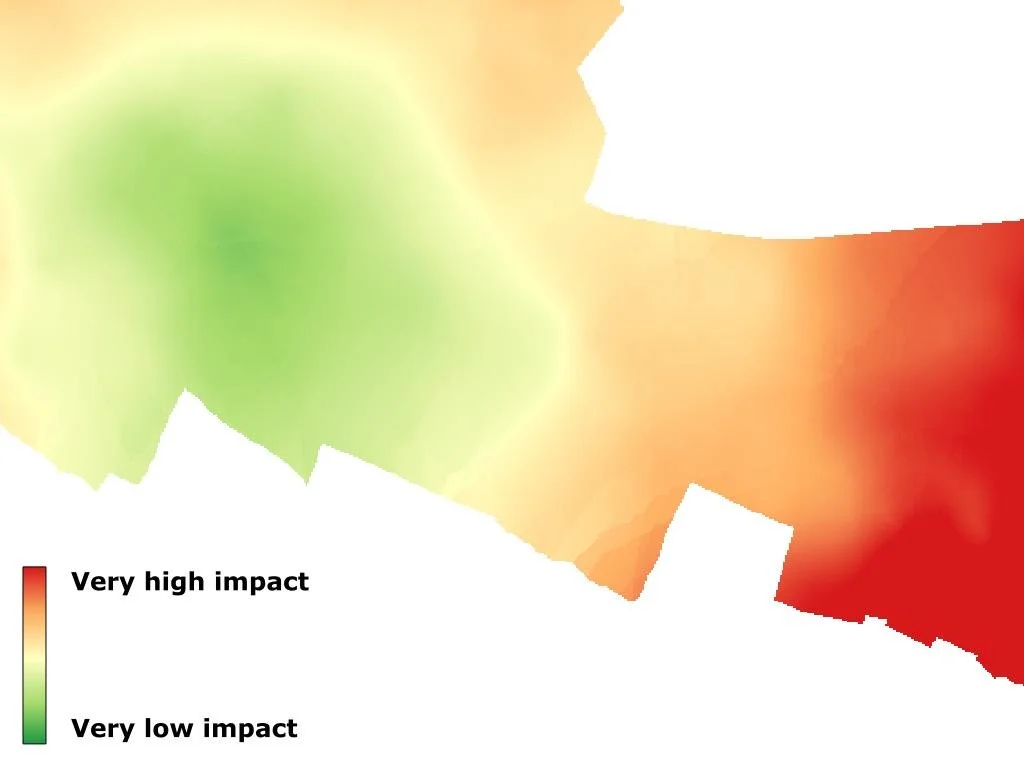
Public transportation travel time impact model for hypothetical Council service provision (A)
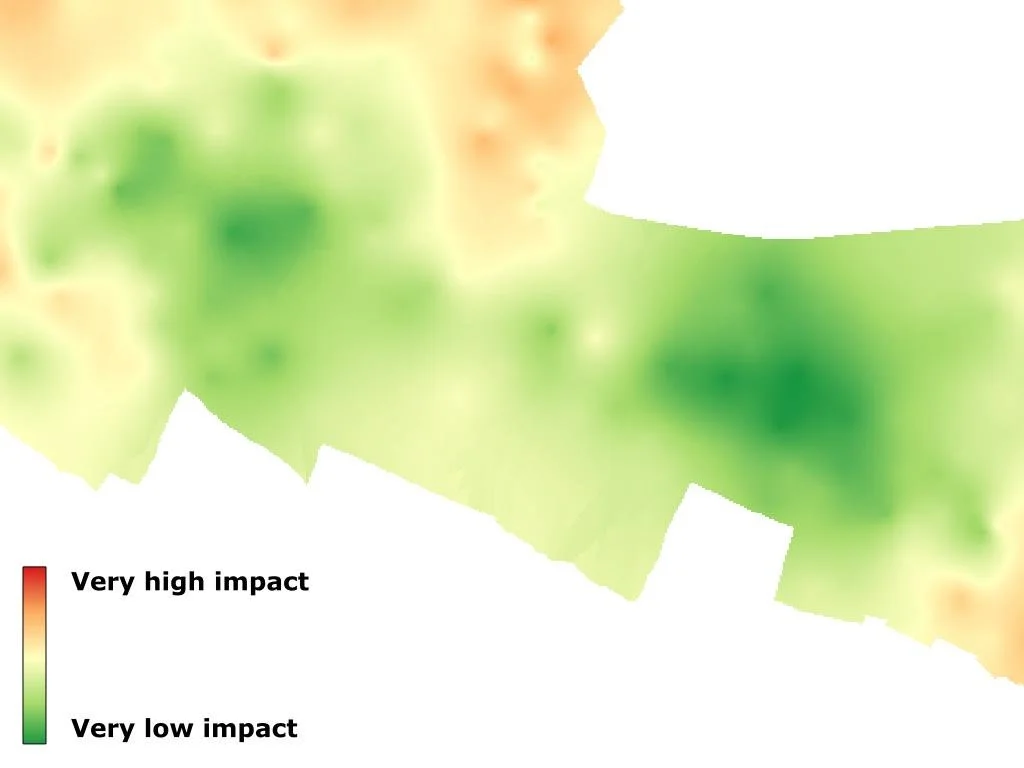
Public transportation travel time impact model for hypothetical Council service provision (B)
Tools used: QGIS, Google Distance Matrix API, Python scripting
As part of a financial restructure, I was tasked with modelling the spatial travel time impacts of reducing the number of council-run public service buildings. Using the Google Distance Matrix API, I calculated travel times between each service building and all Output Areas (OAs) within the borough—across multiple modes of transportation.
This analysis provided critical evidence to support more informed and socially responsible decision-making during a sensitive period of financial change.
With a comprehensive travel time matrix in place, I conducted further analysis to calculate average and median travel times across various administrative boundaries. This enabled a deeper understanding of how changes would affect accessibility across different parts of the borough, particularly from a community perspective.
To ensure an equity-focused approach, the final results were weighted using the Index of Multiple Deprivation (IMD). This allowed us to assess not just the overall impact on travel times, but also how those impacts would disproportionately affect the most vulnerable populations.
Master’s Thesis – Long-Term Analysis of Forest Fires in Portugal
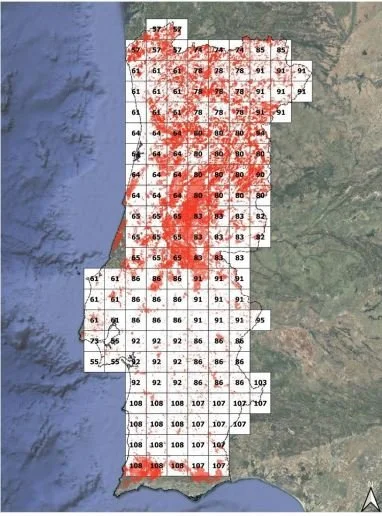
Location of fire occurences in Portugal between 1979 and 2019, over Fire Weather Index Values
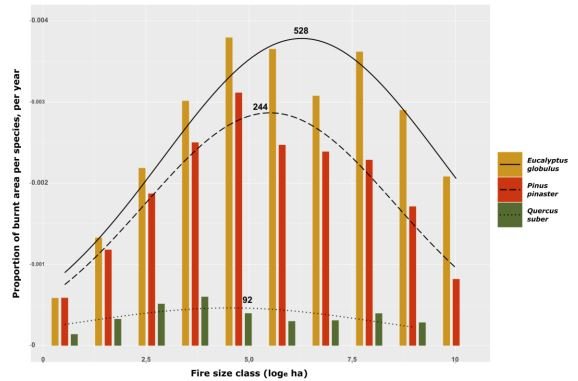
Proportion of burnt species per year, per fire size category (Eucalytpus seems to be associated to bigger fires in Portugal for the study period).
Tools used: QGIS, R scripting, Python scripting, SQL scripting
For my master’s thesis, I conducted an in-depth spatial and statistical analysis of forest fires in Portugal over a 40-year period. The research integrated multiple datasets, including the Fire Weather Index, population density, tree species distribution, and land use, to explore the environmental and anthropogenic factors influencing fire patterns and severity.
The project involved developing and applying complex statistical models to identify long-term trends and spatial patterns. This significantly advanced my proficiency in both statistical analysis and R scripting, as I worked through high-dimensional data and sophisticated modelling techniques.
One of the key findings of the study was the identification of a strong correlation between the density of specific tree species in unmanaged areas and the increase in forest fire size over time. In contrast, areas with active land management practices and a more diverse mix of tree species showed markedly lower trends in fire size across the study period.
This research contributed valuable insights into the relationship between forest composition, land management, and fire resilience—offering evidence to support more sustainable forestry practices.
Thesis available on: https://lup.lub.lu.se/student-papers/search/publication/9075633
Personal GIS Project – Finding the Best Location to Buy a House
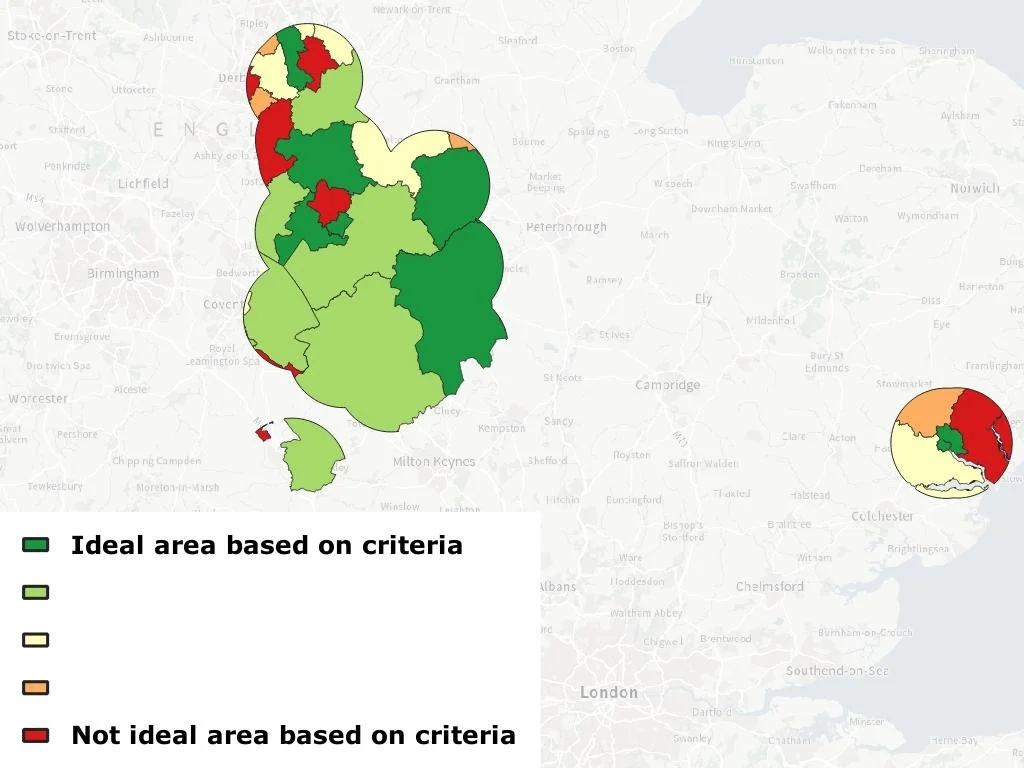
Suitable locations to buy a house, based on average house price, prosperity index criteria, and distance to the nearest train station.
Tools used: QGIS
The process of buying a house can be overwhelming—even from the very first question: "Where should I even start looking?" After asking myself this repeatedly (with growing anxiety), I decided to take a more structured approach and turn the problem into a GIS-based analysis.
And in my case? It worked! The model gave me clarity, saved me time, and helped narrow my search to areas that actually fit my priorities.
I built a custom spatial model to help identify the best areas to buy a house, based on a set of personal and practical criteria. These included an average price set below a threshold; within 15 min drive to a train station, amongst other key criteria.
Using this data, the model highlighted areas that met all the criteria—providing a clear, visual overview of suitable locations. While this project was developed to guide my own decision-making, the same methodology could easily be adapted for more detailed location suitability analyses in professional contexts.